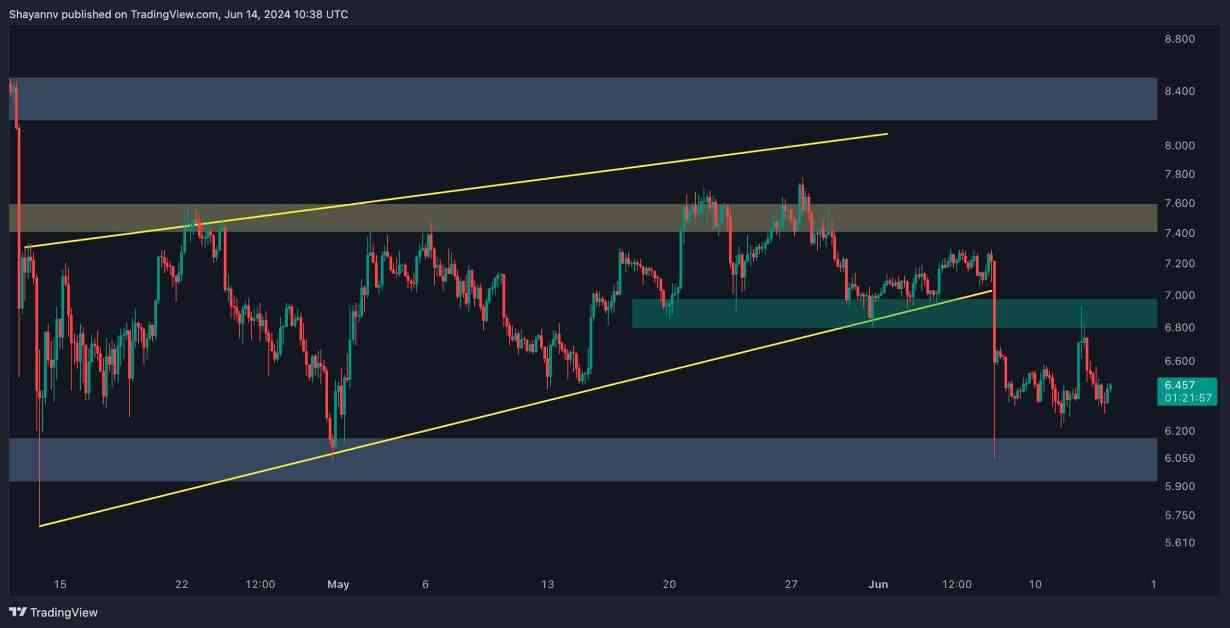
Polkadot’s price has been hovering around the $6.5 mark, showing signs of potential bullish momentum in the short term. The recent consolidation near this critical resistance level suggests a possible uptrend in the near future.
Looking at the technical analysis, the daily chart indicates that Polkadot found strong support at $6.5, which has been a significant level in recent months. This support zone has attracted substantial demand, potentially outweighing the current supply. However, the price is currently stuck within a narrow range, with the $6.5 support and a descending trendline acting as crucial boundaries. A breakout from this range will determine the next move for Polkadot.
On the 4-hour chart, Polkadot saw increased demand around $6.2, leading to a temporary surge towards the $6.8 resistance level. Despite this, the price faced selling pressure and retraced back towards the support level. The rejection at $6.8 indicates a bearish sentiment in the market, with the price struggling to break out of the current range.
In terms of sentiment analysis, the $6.5 level has seen consistent support from buyers, as indicated by the Binance liquidation heatmap. There is significant demand in this price region, with potential resistance at $7.3. If the price manages to break above this level, it could lead to increased market activity and volatility as buyers and sellers engage in a struggle.
Overall, Polkadot’s price analysis suggests a potential bullish reversal in the short term, with key resistance and support levels to watch out for. Traders should keep an eye on the $6.5 support and $6.8 resistance for any breakout opportunities. Additionally, the presence of strong demand near these levels indicates a possible uptrend in the coming days.

