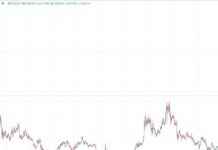
In a recent technical analysis, well-known crypto analyst Big Mike (@Michael_EWpro) has shared an optimistic prediction for Dogecoin (DOGE), suggesting that the meme coin could potentially exceed the $1 mark in the current bull cycle. This forecast for the Dogecoin price is based on the Elliott Wave theory and is supported by a strong set of technical indicators that point to the coin’s significant upward potential.
By examining the weekly chart for DOGE/USDT, we can see that Dogecoin has previously completed a 5-wave Elliott Wave pattern during a previous bull run. This pattern led to the price of Dogecoin reaching just over $0.70. Following this peak, the market experienced a corrective phase characterized by a WXY pattern, which is a complex Elliott Wave correction structure consisting of three distinct price movements. This correction phase marked a period of consolidation and pullback in Dogecoin’s price trajectory after reaching its peak.
According to Big Mike’s analysis, since late 2023, Dogecoin has begun a new 5-wave pattern. This new formation is expected to drive the price of Dogecoin even higher than its previous highs. The first wave of this pattern pushed the price of DOGE to nearly $0.23, followed by a second wave that resulted in a retracement to as low as $0.1140.
The analysis suggests that Dogecoin is currently in the initial stages of the third wave of this Elliott Wave pattern. The third wave is typically the most dynamic and extends the furthest, especially in a strong bullish context. Additionally, the presence of an ascending channel starting from the beginning of wave 1 further supports the bullish sentiment in this analysis. This channel outlines a potential pathway for Dogecoin as it aims for new highs, with the third wave potentially peaking around $0.60.
Wave 4 could potentially pull the price of Dogecoin back to around $0.25 before Wave 5, the climactic phase of the bull run, propels DOGE above the $1 mark. The chart also identifies critical Fibonacci extension levels that are expected to play key roles in determining future price points during this bull run.
Technical indicators such as the weekly Stochastic RSI and the weekly Relative Strength Index (RSI) further support the potential for a bullish phase in Dogecoin’s price. The Stochastic RSI is in the oversold region, indicating a possible price recovery, while the RSI’s upward trend with higher lows suggests increasing bullish momentum.
As of the time of writing, DOGE is trading at $0.1247. The price is currently below the 200-day EMA on the 1-day chart, indicating a potential upward movement in the future.
It’s important to note that the information provided here is for educational purposes only and does not constitute investment advice. Investors are encouraged to conduct their own research before making any investment decisions. Trading and investing in cryptocurrencies carry inherent risks, and individuals should be cautious when navigating the market.


